HZN / DEVLOG
Horizon, evolving
Released versions, improvements and changes.Current version / v0.4.0 ·
v0.4.0
Latest
A workspace beyond investments
- One home for your whole workspace. The dashboard keeps your investment overview and adds business activity, project results and pending work, with monthly income and expenses and an estimated quarterly VAT balance; business accounts never contribute to your investment portfolio.
- Open details when you need them. Compact console windows open from the sidebar, with expanded information in a second window connected to the first by a node, instead of opening a page full of modules at once.
- Charts that share their selection. Diversification and portfolio-history windows synchronize the selected data with their summary; click a history point to pin it with horizontal and vertical crosshairs while you inspect its details.
- Analytics, one section at a time. Open performance, income, platform comparisons, XIRR, breakdowns and statements individually, keeping the relevant summary in the linked window.
- Projects organized around your work. Create projects for clients, boats or general work, then manage their details, folders, documents, notes and databases in dedicated sections and see the business profit assigned to each project.
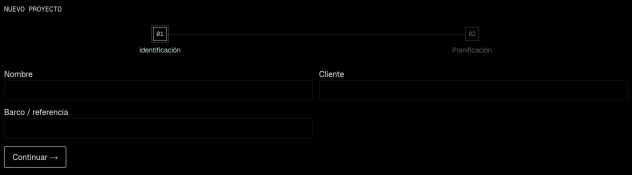
The live project creation form, with identification and planning connected as numbered stages.
Business accounting
- Income and expenses have their own home. Accounting books show business income, costs, profit and estimated VAT due or credit, with separate lists for creating and editing entries and optional links to existing projects.
- Expense entry in clear stages. Choose or create a reusable supplier, enter invoice dates and references, then add products or services with VAT, discounts, withholding and the deductible VAT percentage, with calculated totals before saving.
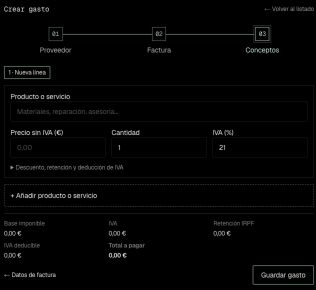
The live expense form at the concepts stage, showing decimal inputs, another-item control and invoice totals. - Bring your Quipu CSV exports. Import expense or income summaries through file selection, review, import and result stages; rows belonging to the same invoice are grouped, original tax amounts and credits are preserved, and each invoice can be assigned to a project.
- Review duplicates before importing. Previously imported Quipu invoices are skipped, changed source records are flagged without overwriting them, and possible matches with manual entries start unchecked; invoice and supplier creation are saved together so a failed batch does not leave a partial import.
Fixes and polish
- Pagination uses the available window space and adapts after resizing, zooming and font loading, instead of hiding rows behind another page while space remains.
- Console title bars align with their borders, repeated module headings have been removed from embedded windows, and accounting selectors match the flat retro interface.
- Decimal fields in expense concepts can be cleared and accept a comma or point; adding another item is now labeled “Add product or service.”
- The sidebar has separate pages for investments, projects and accounting, and multi-stage creation and import flows use the same numbered nodes and connecting lines.
- Expanded modules load on demand, authenticated dashboard reads are shared per request, and long snapshot-history queries are paginated to avoid truncated chart rebuilds.
v0.3.1
Features
- New platform: Wecity. Create a Wecity portfolio and import its wallet export (.csv) — deposits, investments, principal returns, interest and withdrawals, including Spanish long-form dates like "1 ago., 2026". Real-estate crowdfunding valued with the same formula as the other P2P platforms.
- Interest and bonuses, told apart. Passive-income charts no longer lump everything together: recurring interest and one-off bonuses, cashback and referral rewards now show as separate series. On a portfolio's monthly income chart they stack with a legend for each total, Analytics gains an "Interest vs bonus" toggle, and the dashboard's "this month" strip breaks the figure down in-line. Bonuses only appear where you actually earned some.
- Annualized return per platform. Selecting a platform in the diversification chart now shows its annualized return (XIRR) alongside the total, so you can compare platforms you've held for very different lengths of time. It matches the Analytics XIRR table exactly.
Fixes
- Mintos bonuses were missing from your returns. Campaign bonuses and cashback were filed as "other" and silently left out of the gains figure. They now count, and affected portfolios have been recalculated.
Polish
- Leader lines on the full-page diversification chart no longer tangle into staircase artifacts when many small slices cluster together.
v0.3.0
Features
- New platform: Lande. Create a Lande portfolio and import its account statement (.xlsx) directly — deposits, investments, principal repayments, interest, bonuses and cashback, in English or Spanish exports. You can also upload Lande's investments report (optional): the portfolio page gains a "live investments" section showing each loan's interest rate, collateral, country, remaining principal and term.
- A cleaner shell. The top bar is gone. Your profile now lives at the bottom of the sidebar — one row with your account that opens Settings, Subscription, Guide, Refresh and Sign out. Collapse the sidebar from its header; a floating button on the top-left brings it back.
- The diversification chart tells you more. On the full-page view, hovering a slice swaps the center for that platform's value and share of the portfolio, the selection sticks until you click empty space, and the chart rests dimmed so what you select lights up. The dashboard widget keeps its classic look: biggest platform selected, portfolio count in the middle.
Fixes
- Imports can no longer destroy data. The importer refuses positions reports (like Lande's investments file) up front, and for everything else it only replaces existing transactions after the file has provably parsed into new ones — a bad or mistaken file used to be able to wipe a portfolio and insert nothing.
- Accurate XIRR and Statement. Crypto flows were counted in coin units instead of euros, manually-added purchases could subtract from yearly investment totals, and leftovers from deleted portfolios inflated deposits. All fixed — your Analysis numbers now reflect reality (global XIRR included).
- One number for Indemo and Urbanitae too. The same alignment MyInvestor got: every calculator now classifies platforms identically, so the list, the header and the chart agree.
v0.2.1
Features
- Open any dashboard card full page. Hover a card and hit the expand button — the global summary, diversification or portfolio list gets a whole page to itself, with a back link to the dashboard.
- A fully labeled diversification chart. In the full-page view every platform is named around the ring with a leader line, percentages render inside the slices that fit them, and your total sits in the middle. Works in platform, asset-type and nested views — 30 platforms stay readable.
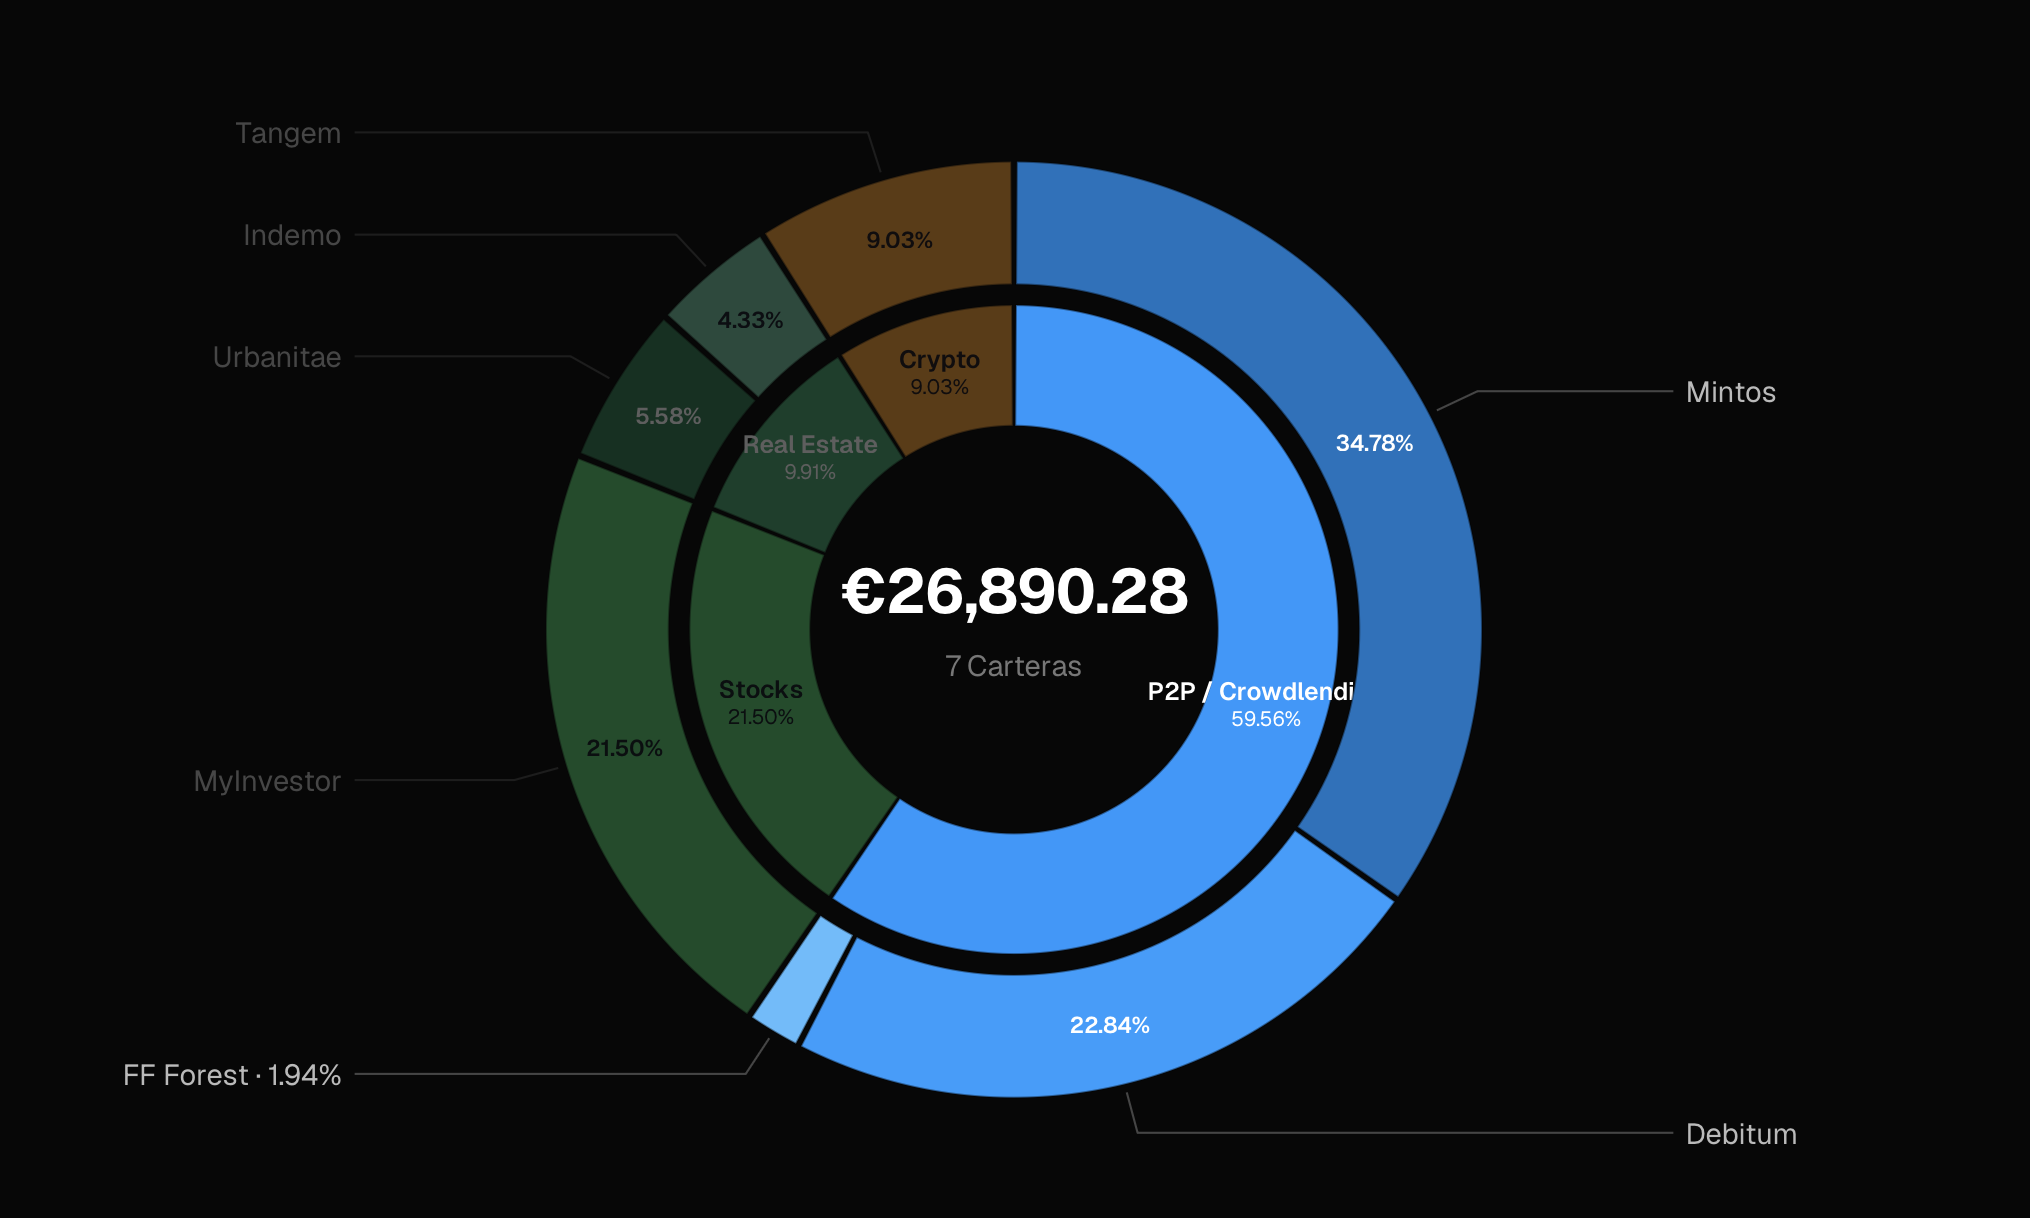
Nested diversification chart with every platform labeled around the ring, percentages inside the slices and the portfolio total in the middle. - Dividends record themselves. Stocks/ETF portfolios now check the dividends their holdings pay and add the missing entries automatically — they flow into the Analysis income chart, the portfolio's own income chart and its value. Amounts are gross estimates (taxes vary); edit any entry to the net you received.
- Shares match the view you share from. Sharing from the dashboard widget keeps the compact card; sharing from the full-page view produces the labeled chart on the public page and on the social preview image.
Fixes
- One number everywhere. The Portfolios list, each portfolio's header, its P/L section and the chart could each show a different return — stale stored values, two different cost-basis formulas and a chart baseline that ate day-one moves. All of them now derive from the same live value, re-marked at current prices while you browse, and "all history" on the chart equals your total return.
- Charts update the moment a CSV import finishes.
v0.2.0
Features
- Two new platforms: Esketit and FF Forest. Export your statement and import it like any other platform. Esketit handles both the Ireland and Croatia exports (the column order differs between them); FF Forest reads its
.xlsxdirectly. Interest, principal, deposits and investments are all mapped automatically. - Passive income on your dashboard. Right under your global total you now see what you've earned this month in interest and dividends across every portfolio — "This month you've earned €78.98".
- The whole app is now in English. Every screen, chart, tooltip, table and importer has been translated. (The legal pages stay in Spanish — they're a Spanish-jurisdiction contract.)
- Notable-move markers on the main chart. Days where a holding moved 5% or more day-over-day get a marker on the historical graph, so a big jump or drop is easy to spot and click into.
- "Coming soon" platforms are clearly marked. Platforms we don't parse yet now show as "Coming soon · manual entries only" in the picker, so you know up front whether a CSV import will work or whether you'll be adding entries by hand.
Fixes
- Portfolio value and return now agree everywhere. A stocks/ETF portfolio could show slightly different P/L figures across the Carteras list, the portfolio page and the positions card. They now all read the same source, so the number is consistent wherever you look.
- The page refreshes itself after an import. New transactions, totals and the "last transaction" date used to require a hard reload to appear. They now show up on their own when the import finishes.
v0.1.2
Features
- Underlying assets in diversification. Hovering or clicking a crypto / stocks / ETF slice now shows the actual holdings inside — BTC, XRP, SP500, OKLO, etc. — with EUR value and share-of-platform. In Nested mode this aggregates across all platforms in the type so you see "how much BTC do I really have" at a glance.
- Click-to-pin slice selection. Click a donut slice to lock the detail panel on it; hover keeps working as a peek while the cursor is over the donut, but the pinned slice takes over the moment you leave. Click the same slice again to release.
Fixes
- Crypto values were stale until the next day. The daily snapshot cron ran 10 minutes before the price-refresh cron, so every day's numbers used yesterday's crypto prices. Tangem showed €2.495 in the per-portfolio chart while the dashboard donut showed €2.702 with today's prices. Re-ordered the crons (prices at 00:00, snapshot at 00:20) and added a value-override path so the snapshot writes the exact same number the dashboard reads.
- Indemo doubled its value on the global chart. When Indemo was reclassified from P2P to Real Estate, the snapshot math fell into the stocks branch which counted both deposits and buys, doubling the value from €1.165 to €2.317 and inflating the global return by ~€1.000. The P2P-style detector now matches by platform name, not by the user-visible asset type — reclassifying a platform changes its colour bucket without breaking its math.
- Stocks lagged on weekends. Yahoo doesn't price stocks at the weekend, so the SQL snapshot for MyInvestor read Friday's close while the dashboard showed live values. Snapshots now use the live values directly when available.
- Diversification card overflowed on mobile. Header buttons no longer push past the viewport; the detail panel grid uses
v0.1.1
Features
- Analytics page redesign. A KPI strip now anchors the top of the page — Balance, Invested, Return, all-time XIRR, Income YTD with this month's slice, and your best / worst platform side-by-side. The Performance chart stays where it always was. Income and Platform Balance charts now sit in a two-column grid below it on wide screens so you see twice as much without scrolling. Wide tables (XIRR, Income breakdown, Statement) stay full-width because they actually need the space.
Polish
- Sections now use a tighter 24px gap instead of 32px — the page reads as one composition, not a stack of independent islands.
v0.1.0a
Fixes
- Diversification chart no longer "slides" between slices on hover. Selecting a platform with many assets was making the detail panel grow, which re-centred the donut vertically — your cursor ended up on a different slice and triggered another hover, in a loop.
v0.1.0
Features
- Diversification: by asset type. New toggle in the diversification card lets you slice your portfolio by P2P / Stocks / Crypto / Real Estate / Cash instead of by platform. Each type has its own stable colour so the chart reads as categories, not random hashes.
- Nested sunburst view. A third toggle option draws two concentric rings — outer = asset type, inner = platforms inside that type. Hovering a platform highlights its slot under the parent category.
- Platform colours derived from their type. Inside Crypto every platform is a different shade of orange; inside P2P every platform is a shade of blue. The chart finally reads as a family.
- Underlying assets in the detail panel. When you select a crypto or stocks platform the right panel lists what's actually inside — BTC, XRP, SP500, etc. — with EUR value and share-of-platform.
- Shareable diversification cards. Generate a public link to a frozen snapshot of your diversification. The card renders an Open Graph image so Twitter / WhatsApp / Slack show a rich preview. Optional EUR / % toggle, full URL printed on the image, high-DPI download button (3x).
- Public changelog at `/news`. This page. Shows every notable release, what landed, in plain English.
Polish
- Share-card brand wash redesigned as an LV-style dense monogram — small Horizon marks, tight grid, alternating row offset.
- Footer of the OG image now prints the full share URL so anyone who screenshots it can still find the original.